Who We Support With Server Monitoring Services
HEX64 monitors servers for organizations at every stage of complexity and infrastructure maturity
Establish a structured server monitoring practice from day one — covering Windows, Linux, cloud workloads, and applications — without hiring a dedicated server engineer.
Centralized server monitoring across multi-vendor, multi-site environments. Standardized SLAs. Per-site performance reporting. Audit trails that survive procurement and regulatory reviews.
HIPAA-aligned server monitoring with documented compliance trails. Maintenance windows that respect patient-care schedules. Special attention to clinical application servers, EHR databases, and PACS storage.
PCI-DSS-aligned server monitoring with documented evidence for assessors. Quarterly compliance reports. Special attention to payment processing servers, database servers holding cardholder data, and audit log integrity.
Application server monitoring tuned for high-availability SaaS workloads. API endpoint health, request latency, queue depths, error rates. The metrics that determine user experience, not just whether the box is on.
Healthcare (HIPAA), Finance (PCI-DSS, SOC 2), Manufacturing, Retail, SaaS, Logistics, Professional Services, Education, Government. Industry-specific compliance frameworks integrated into standard server monitoring procedures.
Why Choose HEX64 for Server Monitoring?
Five reasons organizations choose HEX64 for server monitoring specifically:
- Multi-OS expertise by default — Windows Server, all major Linux distros, VMware, Hyper-V, cloud-native compute — not ‘Windows + Linux available on the enterprise tier’
- Application-aware monitoring — not just ping, CPU, and disk. Process health, service restart loops, queue depths, API latency, database query performance
- Tool-agnostic by design — we operate inside Datadog, ManageEngine, Site24x7, PRTG, SolarWinds, Nagios, Zabbix, CloudWatch, Azure Monitor. You don’t migrate tools.
- Severity SLAs in writing — P1 Critical 5 min, P2 High 30 min, P3 Normal 2 hr, P4 Low 4 hr — contractual, tracked, reported monthly
- Operating server monitoring since 2016 — ISO 27001 certified, audited annually, procurement-ready
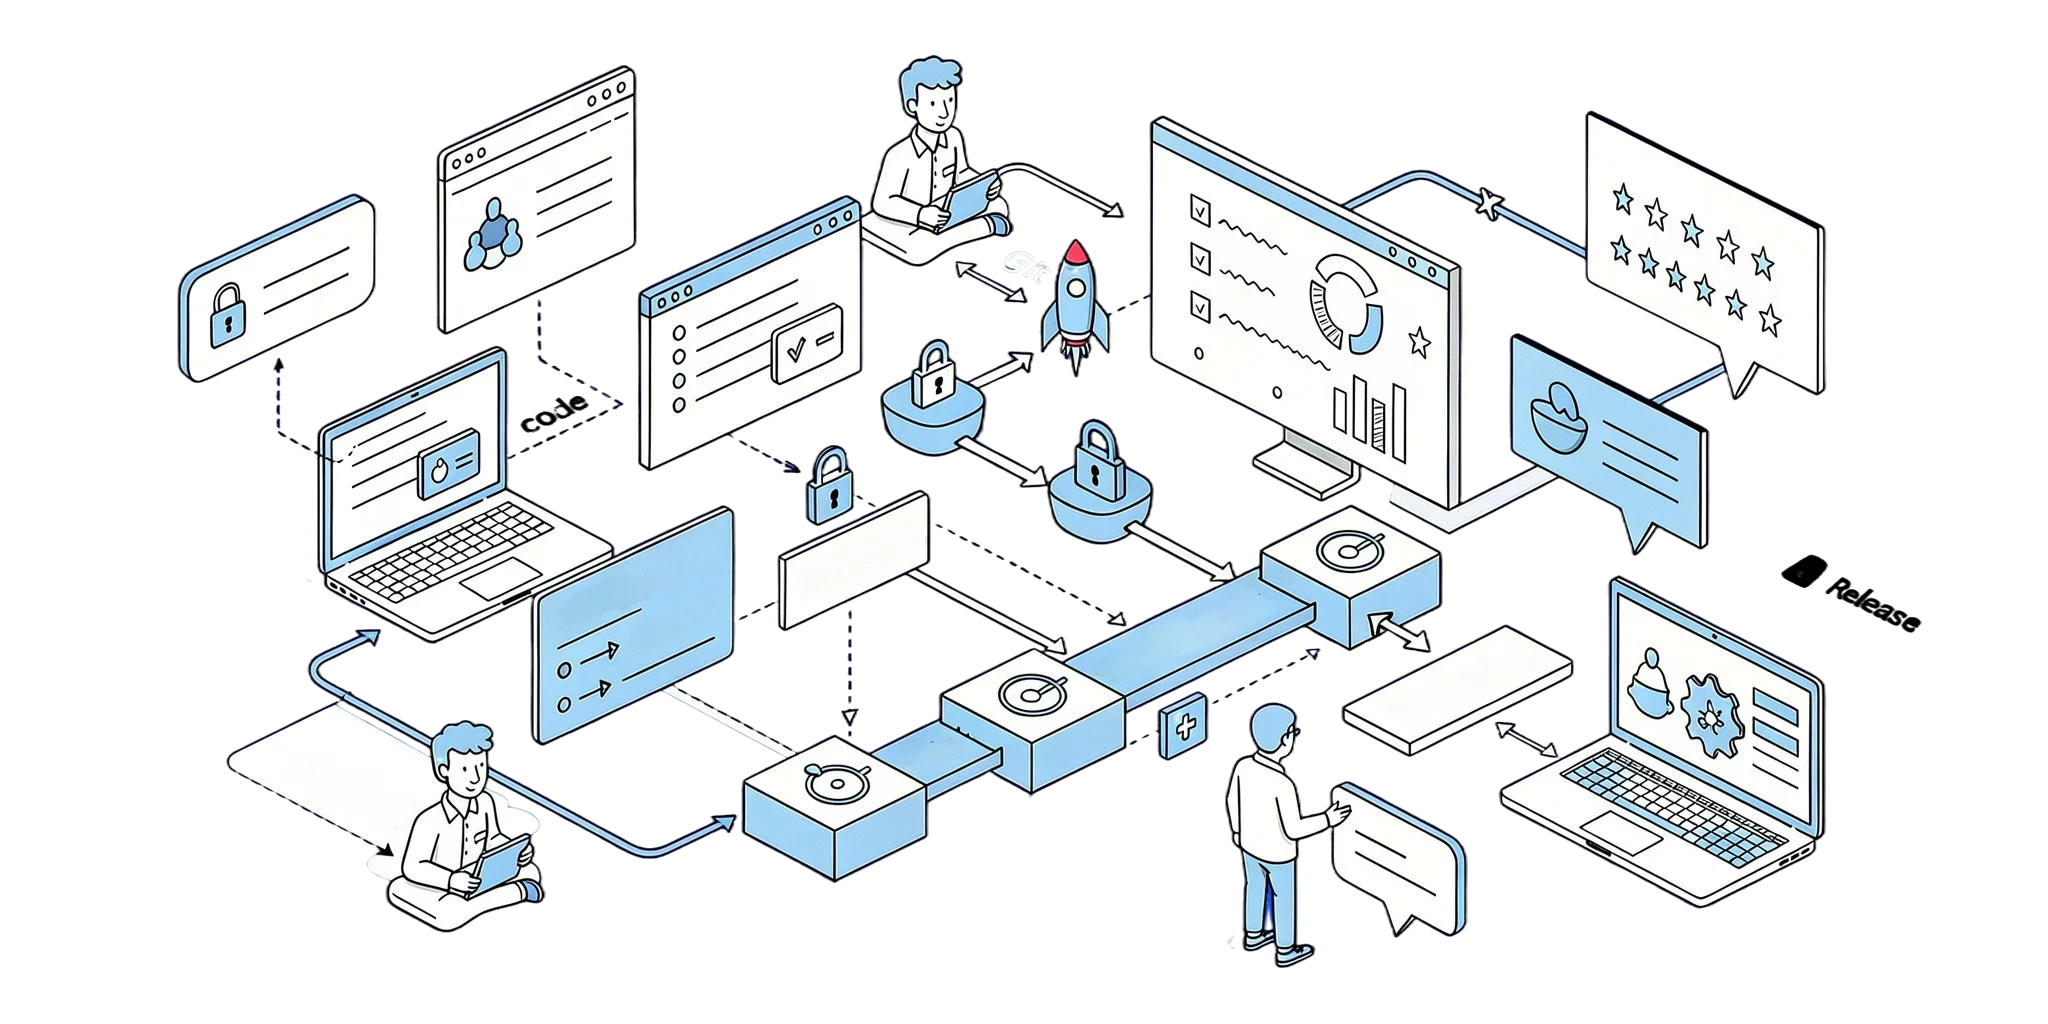
How HEX64 Delivers Server Monitoring Services
A structured 3-stage server monitoring approach focused on coverage, calibration, and continuous improvement
1
Server Inventory & Monitoring Scope Definition
- Inventory of physical and virtual servers, OS versions, applications, and dependencies
- Current monitoring tool assessment — what’s being monitored, what isn’t, what’s noisy
- Severity classification, SLA target alignment, and escalation path documentation
Outcome: A written server monitoring scope with explicit coverage boundaries — plus the gaps audit you didn’t know you needed.
2
Tool Integration & Threshold Calibration
- Integration with your existing monitoring stack — Datadog, ManageEngine, PRTG, SolarWinds, Nagios, Zabbix, CloudWatch, Azure Monitor
- Threshold calibration to your actual server baselines — not vendor defaults
- Alert routing configured to your team’s escalation paths, with runbooks documented per alert class
Outcome: An integrated, calibrated monitoring environment that filters noise into signal.
3
Pilot Validation & 24/7 Go-Live
- Pilot monitoring on controlled subset of servers — real alerts processed through full workflow
- SLA performance measured against the contractual framework
- Transition to full 24/7 server monitoring across complete scope, with monthly review cadence
Outcome: Stable, fully operational server monitoring with predictable SLA performance and continuous improvement.

Ryan Jensen
Client Experience & Feedback
End-to-end support from start to success
“They provide high quality and reliable services; we are satisfied with the services offered. Its pleasure working with HEX64”
Expert Insight
“Most server outages are predictable in retrospect — a disk that was filling for three weeks, a memory leak that was growing nightly, a database query that started running 40% slower a month ago. The signals were in the data. The problem is rarely the absence of data; it’s the absence of someone watching the right data at the right time. Good server monitoring is just continuous, attentive pattern recognition. That’s the discipline we deliver.”
Our Technology Expertise, Compliance & Platform Experience
The capabilities enterprise clients and procurement teams typically review during vendor assessment. Our server monitoring engineers have hands-on experience across the operating systems and platforms enterprise environments actually run on. Operating systems: Windows Server 2012, 2016, 2019, 2022, 2025; Windows 10/11; Red Hat Enterprise Linux, Ubuntu Server, CentOS, Rocky Linux, AlmaLinux, SUSE Linux Enterprise, Debian, Oracle Linux, Amazon Linux. Virtualization: VMware ESXi, vSphere, vCenter; Microsoft Hyper-V; Citrix Hypervisor; Proxmox. Cloud compute: AWS EC2, ECS, EKS, Lambda; Azure VMs, AKS, App Services; Google Cloud Compute Engine, GKE; Oracle Cloud OCI. Database engines: Microsoft SQL Server, MySQL, PostgreSQL, MariaDB, Oracle Database, MongoDB. Monitoring tools we operate inside: Datadog, New Relic, Dynatrace, Site24x7, ManageEngine OpManager, ManageEngine Applications Manager, PRTG, SolarWinds Server & Application Monitor, Nagios, Zabbix, AWS CloudWatch, Azure Monitor, Google Cloud Operations. Compliance frameworks: ISO 27001 (certified, audited annually), ISO 9001 (certified), SOC 2 Type II, HIPAA-ready, PCI-DSS aware, GDPR compliant. Documentation available within 48 hours during due diligence.
Frequently Asked Questions — Server Monitoring Services
Server monitoring services are 24/7 managed monitoring of your physical, virtual, and cloud servers — covering CPU, memory, disk, process health, service status, application performance, log events, and security telemetry. HEX64 server monitoring is delivered by certified engineers actively watching dashboards every shift, not just automated alerts hitting an inbox.
NOC monitoring covers the full infrastructure stack — servers, networks, applications, security, cloud workloads. Server monitoring focuses specifically on the server layer: operating systems, applications, databases, virtualization hosts, cloud compute. Most enterprises need both. Some only need server-layer specialism for their environment. We do either.
Windows Server 2012-2025, Windows 10/11, Red Hat Enterprise Linux, Ubuntu, CentOS, Rocky Linux, AlmaLinux, SUSE, Debian, Oracle Linux, Amazon Linux. Virtualization: VMware ESXi, vSphere, vCenter; Microsoft Hyper-V; Citrix Hypervisor. Cloud compute: AWS EC2, Azure VMs, Google Cloud, Oracle OCI. Databases: SQL Server, MySQL, PostgreSQL, MariaDB, Oracle, MongoDB.
Tool-agnostic. We operate inside Datadog, New Relic, Dynatrace, Site24x7, ManageEngine OpManager, ManageEngine Applications Manager, PRTG, SolarWinds Server & Application Monitor, Nagios, Zabbix, AWS CloudWatch, Azure Monitor, Google Cloud Operations. You don’t migrate tools.
Yes. 24/7/365 coverage including overnight, weekends, and public holidays — across all major time zones (USA, Canada, UK, EMEA, UAE, APAC). Critical server alerts at 3am Saturday get the same 5-minute response commitment as alerts at 10am Tuesday.
P1 Critical (server down, multi-user impact, security event) — 5 minute first response. P2 High (significant performance degradation, application failure) — 30 minutes. P3 Normal (single-user impact, non-critical alerts) — 2 hours. P4 Low (informational, scheduled) — 4 hours. Contractual SLAs tracked monthly.
Read-level monitoring access by default. Configuration or remediation access requires time-bound, audited elevation — never standing admin rights. NDA signed before access provisioned. MFA enforced on every remote session. All actions logged with timestamp, engineer ID, system touched, ticket reference. ISO 27001 certified, SOC 2 Type II aligned, GDPR compliant, HIPAA-ready.